Observability for Tool-Using AI Agents
Learn how to debug AI agents in production with run-scoped traces, stable span attributes, redacted payloads, token and cost metrics, and tail sampling.
Introduction
A failing web request is usually easy to explain. There is one entry point, a handful of downstream calls, and a status code at the end. A failing agent run is different. It may have made nine model calls, selected six tools, retried two of them, waited eleven minutes for an approval, spent a few dollars in tokens, and stopped in a state nobody can describe without reading raw logs.
Traditional application logging does not survive that shape. Prompt dumps are too large to keep, too sensitive to export, and too unstructured to query. Meanwhile the questions operators actually ask are boringly specific: which tool failed, how much did this tenant spend today, why is this run stuck, and did the agent write anything before it died.
This article covers the instrumentation that answers those questions. The examples use TypeScript and OpenTelemetry-style primitives, but the design applies to any runtime that executes model-selected tools: queue workers, workflow engines, serverless jobs, or a long-lived agent service.
Model a Run as a Trace, Not a Log Stream
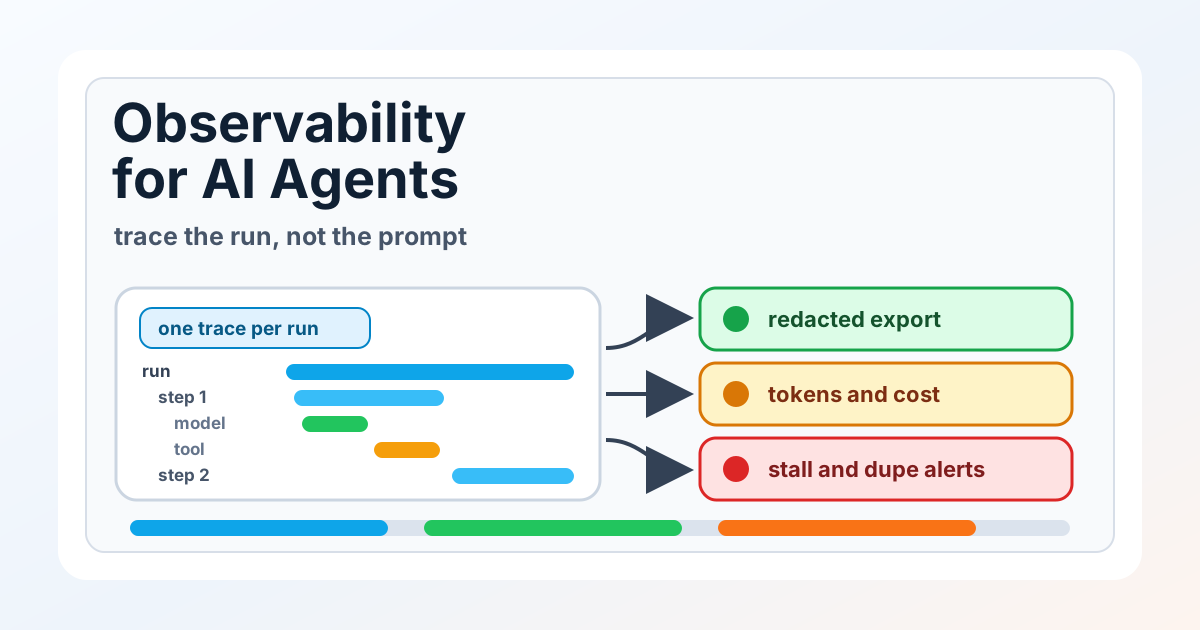
The unit of debugging for an agent is the run, not the request. A run has a lifetime, a budget, a terminal status, and a tree of decisions inside it. That maps naturally onto a trace, so start by giving every run a trace ID and every decision a span.
A four-level hierarchy covers most agent runtimes:
- Run — the whole task, from goal to terminal status.
- Step — one iteration of the agent loop, holding whatever the model decided this time around.
- Model call — a single request to the model, with its token usage and chosen tool.
- Tool call — one validated tool invocation, including retries and policy decisions.
type SpanKind = "run" | "step" | "model" | "tool" | "policy";

type AttributeValue = string | number | boolean | string[];

type SpanStart = {
  kind: SpanKind;
  name: string;
  attributes: Record<string, AttributeValue>;
};

type SpanEnd = {
  status: "ok" | "error";
  attributes?: Record<string, AttributeValue>;
};

interface ActiveSpan {
  setAttributes(attributes: Record<string, AttributeValue>): void;
  end(result: SpanEnd): void;
}

interface AgentTracer {
  start(span: SpanStart): ActiveSpan;
}

async function withSpan<T>(
  tracer: AgentTracer,
  start: SpanStart,
  body: (span: ActiveSpan) => Promise<T>,
): Promise<T> {
  const span = tracer.start(start);

  try {
    const result = await body(span);
    span.end({ status: "ok" });
    return result;
  } catch (error) {
    span.end({
      status: "error",
      attributes: {
        "error.type": error instanceof Error ? error.name : "unknown",
        "error.message": error instanceof Error ? error.message : String(error),
      },
    });
    throw error;
  }
}
The important detail is that the span closes on the error path too. Agent runtimes are full of await chains that abandon work on timeout, and an unfinished span is worse than no span: it looks like the step is still running long after the worker died.
Keep the trace ID when the process does not
Agent runs outlive processes. A run can pause for an approval, get picked up by another worker, or resume after a deploy. If the trace context lives only in memory, the second half of the run becomes an orphan trace and the interesting failure is exactly at the seam.
Persist the trace ID and the current step's span ID alongside the run's durable state, then resume as a child of the stored context. The result is one trace that spans hours and several processes, which is what you need when the question is "what happened before it got stuck."
Choose Attributes That Answer Real Questions
Spans are only as useful as the fields you can filter on. Decide what an operator will type into a query box at 2 a.m., then make sure those fields exist on every relevant span with the same name and the same type.
type ModelSpanAttributes = {
  "gen_ai.operation.name": "chat";
  "gen_ai.system": string;
  "gen_ai.request.model": string;
  "gen_ai.response.model": string;
  "gen_ai.usage.input_tokens": number;
  "gen_ai.usage.output_tokens": number;
  "gen_ai.response.finish_reasons": string[];
  "agent.run.id": string;
  "agent.step.index": number;
  "agent.cost.micros": number;
};

type ToolSpanAttributes = {
  "agent.run.id": string;
  "agent.step.index": number;
  "agent.tool.name": string;
  "agent.tool.effect": "read" | "write";
  "agent.tool.idempotency_key": string;
  "agent.tool.attempt": number;
  "agent.policy.decision": "allowed" | "denied" | "needs_approval";
  "agent.tenant.id": string;
};
Three of these carry most of the debugging weight. agent.tool.effect lets you separate harmless reads from writes that may need reconciliation. agent.tool.idempotency_key links the span to the durable command record, so a trace and a database row can be joined without guesswork. agent.policy.decision records that the runtime made a choice, which is how you prove a denied call never executed.
Use the GenAI conventions, but pin your own namespace
OpenTelemetry's generative-AI semantic conventions give you gen_ai.* names for model calls, and adopting them means vendor dashboards understand your traces without custom mapping. They are also still evolving, and attribute names in that namespace have changed between releases.
The practical compromise is to emit the conventional names for model-level facts and keep your own agent.* namespace for workflow facts the spec does not cover: run IDs, budgets, approvals, idempotency keys, and policy decisions. When the convention shifts, you update one adapter instead of every dashboard and alert you own.
Record the decision, not the prose
It is tempting to attach the model's reasoning text to the span, and it is almost always the wrong default. The text is large, sensitive, expensive to index, and rarely the thing you filter on. Attach the structured outcome instead — selected tool, argument hash, finish reason, retry count, policy verdict — and keep the prose in a payload store you can open on demand.
Redact at the Boundary, Not in the Backend
Agent spans carry tool arguments, and tool arguments carry whatever the user was talking about: customer records, ticket bodies, file contents, occasionally an access token the model helpfully copied from earlier context. Once that leaves your process it is in a third-party index, subject to their retention policy rather than yours.
Redact in the exporter path, before anything is serialized for transport.
const SENSITIVE_KEYS = new Set([
  "password",
  "secret",
  "token",
  "api_key",
  "authorization",
  "access_token",
  "refresh_token",
  "cookie",
]);

const MAX_STRING = 256;

function redactValue(value: unknown): unknown {
  if (Array.isArray(value)) {
    return value.map(redactValue);
  }

  if (value && typeof value === "object") {
    return Object.fromEntries(
      Object.entries(value as Record<string, unknown>).map(([key, nested]) => [
        key,
        SENSITIVE_KEYS.has(key.toLowerCase()) ? "[redacted]" : redactValue(nested),
      ]),
    );
  }

  if (typeof value === "string" && value.length > MAX_STRING) {
    return `${value.slice(0, MAX_STRING)}[truncated ${value.length - MAX_STRING}]`;
  }

  return value;
}
A denylist alone is not a compliance story. It catches the obvious keys and nothing else, so pair it with two stronger controls: an allowlist of argument fields that specific tools may export in full, and a size cap that pushes anything large out of the span entirely.
Store big payloads by reference
Spans should stay small enough to sample and index cheaply. When a tool result is a 40 KB document, write the payload to object storage under a run-scoped key and put only the pointer and a hash on the span.
const MAX_INLINE_PAYLOAD = 1024;

async function attachPayload(
  span: ActiveSpan,
  store: PayloadStore,
  runId: string,
  stepIndex: number,
  label: string,
  payload: unknown,
) {
  const body = JSON.stringify(redactValue(payload));

  if (body.length <= MAX_INLINE_PAYLOAD) {
    span.setAttributes({ [`agent.payload.${label}`]: body });
    return;
  }

  const key = `runs/${runId}/${stepIndex}/${label}.json`;
  await store.put(key, body);

  span.setAttributes({
    [`agent.payload.${label}.ref`]: key,
    [`agent.payload.${label}.bytes`]: body.length,
    [`agent.payload.${label}.sha256`]: sha256(body),
  });
}
The hash is what makes this worth the extra call. It lets you compare two runs that "did the same thing" and prove whether the arguments were actually identical, without ever exporting the arguments themselves.
Measure What Operators Page On
Traces explain one run. Metrics tell you whether the fleet is healthy, and they are what alerts should read from, because they are cheap, complete, and unaffected by sampling.
const runsFinished = meter.createCounter("agent.runs.finished");
const runDuration = meter.createHistogram("agent.run.duration", { unit: "s" });
const runSteps = meter.createHistogram("agent.run.steps");
const toolCalls = meter.createCounter("agent.tool.calls");
const tokensUsed = meter.createCounter("agent.tokens.used");
const costMicros = meter.createCounter("agent.cost.micros");

function recordToolCall(tool: string, outcome: "ok" | "error" | "denied") {
  toolCalls.add(1, { tool, outcome });
}

function recordRunFinished(run: FinishedRun) {
  const labels = {
    workflow: run.workflow,
    status: run.status,
    reason: run.reason,
  };

  runsFinished.add(1, labels);
  runDuration.record(run.durationMs / 1000, { workflow: run.workflow });
  runSteps.record(run.steps, { workflow: run.workflow });
  tokensUsed.add(run.tokens.input, { workflow: run.workflow, direction: "input" });
  tokensUsed.add(run.tokens.output, { workflow: run.workflow, direction: "output" });
  costMicros.add(run.costMicros, { workflow: run.workflow, model: run.model });
}
Watch the label sets. workflow, status, reason, tool, and model are bounded and safe. run_id, tenant_id, user_id, and anything derived from model output are not — they turn one metric into millions of time series and will eventually cost more than the agent. Keep unbounded identifiers on spans, where the storage model expects high cardinality.
Attribute cost to something you can act on
Token counters are only interesting when they roll up to a decision. Record cost in integer micros rather than floating-point dollars, so the numbers stay exact through aggregation, and attach the workflow and model as labels so you can answer the two questions that matter: which workflow got more expensive after the last deploy, and which model change actually paid for itself.
For per-tenant spend, aggregate from the durable run records rather than the metrics pipeline. Billing needs exact numbers over a billing period, not sampled telemetry with a retention window.
Sample Long Runs Without Losing Failures
Head-based sampling is a poor fit for agents. The decision gets made when the run starts, which is exactly when you know the least about whether it will be interesting. A run that looked routine for eight steps and then double-charged a customer is the one trace you cannot afford to have dropped at step one.
Decide at the end of the run instead, and bias hard toward keeping anything unusual.
type RunSummary = {
  runId: string;
  workflow: string;
  status: "completed" | "failed" | "blocked" | "cancelled";
  steps: number;
  durationMs: number;
  costMicros: number;
  wroteSideEffect: boolean;
  hadRetry: boolean;
};

function shouldKeepTrace(run: RunSummary, keptWorkflows: Set<string>): boolean {
  if (run.status !== "completed") return true;
  if (run.wroteSideEffect || run.hadRetry) return true;
  if (run.steps > 20 || run.durationMs > 60_000) return true;
  if (run.costMicros > 50_000) return true;

  if (!keptWorkflows.has(run.workflow)) {
    keptWorkflows.add(run.workflow);
    return true;
  }

  return hashToUnitInterval(run.runId) < 0.05;
}
The last line uses a hash of the run ID rather than a random number on purpose. A deterministic function gives every component that sees the run — the worker, the collector, a replay job — the same answer, so a trace is never half-kept because two processes rolled different dice.
Keeping at least one full trace per workflow is the cheap part of this policy and often the most useful. It gives you a known-good reference to diff against when someone reports that a workflow "used to work."
Close the Loop with a Terminal Event
Every run should end by writing one durable, structured record that explains itself. This is the piece teams skip, and it is the reason support tickets turn into archaeology.
type RunFinishedEvent = {
  type: "run_finished";
  runId: string;
  traceId: string;
  workflow: string;
  status: "completed" | "failed" | "blocked" | "cancelled";
  reason:
    | "goal_reached"
    | "budget_exhausted"
    | "approval_expired"
    | "policy_denied"
    | "tool_unavailable"
    | "operator_cancelled"
    | "unrecoverable_error";
  steps: number;
  costMicros: number;
  tokens: { input: number; output: number };
  sideEffects: Array<{
    tool: string;
    idempotencyKey: string;
    outcome: "applied" | "skipped" | "unknown";
  }>;
};
Two fields here do disproportionate work. reason separates failures that need engineering attention from stops that were the system working correctly — a run that halted on an exhausted budget is not an incident, and it should never page anyone. And an unknown side-effect outcome is the flag that a write may or may not have landed, which is the signal a reconciliation job should consume before anyone retries by hand.
Alert on stalls and duplicates, not on error rate
Agent failures are rarely loud. The symptoms that actually correlate with user pain are stalls and repeats, so build the first alerts around those:
- Runs in a non-terminal state past their deadline, which means a worker died holding the lease.
- Approval requests older than their expiry with nobody notified.
- Two applied side effects sharing an idempotency key, which is a correctness bug by definition.
- A rise in
unknownoutcomes, meaning reconciliation is falling behind. - Cost per completed run climbing while completion rate stays flat, the usual signature of a retry loop.
Each of these is answerable from the terminal event and the metrics above, without touching a sampled trace. Traces are for the follow-up question: once an alert says a run stalled, the trace shows which tool it was waiting on.
Conclusion and Next Steps
Instrumenting an agent is not the same job as instrumenting a service. The run is the unit of work, the interesting state is durable rather than in-process, and the most expensive failures are silent ones where something got written twice or nothing got written at all.
Start with the run trace and the terminal event, since together they explain almost every support question you will get. Add token and cost counters next, with bounded labels and integer micros. Then tighten the export path: redact by allowlist, push large payloads to storage by reference, and switch to tail sampling that always keeps failures, retries, and writes. Once those are in place, an operator can answer what the agent did, what it spent, and whether it left anything half-finished, without reading a single prompt.
About this story
This article was written by Gen-AI using GPT 5.5 or Opus 4.7. Verify technical guidance before using it in production systems.